
OUR PERFORMANCE
Financial review
These results represent the group’s first full 12-month reporting period since listing. The previous report covered the four-and-a-half month period between listing and the 2016 financial year-end. The trading results of Storage RSA are included in the group results for the one-month period from the effective date of acquisition to year-end.
A self storage unit is rented to a customer on a month-to-month basis with a minimum one-month term. The rental agreement continues indefinitely until the customer provides notice of termination.
Self storage is a dynamic business – in any month, customers move in and out, resulting in changes in occupancy and the average rental rate. The churn rate – the percentage of customers moving out each month – is approximately 5 – 6% and although this may vary between properties, it is generally consistent across the portfolio.
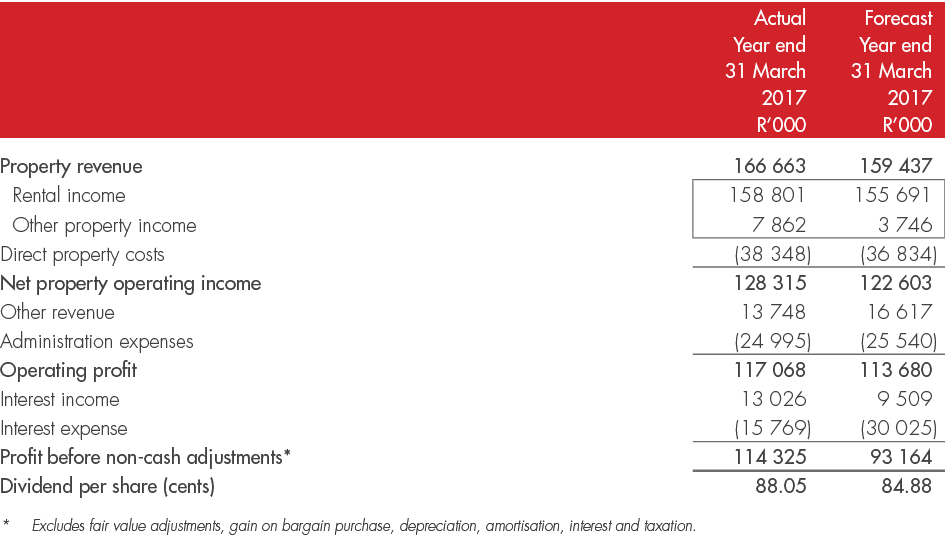
FINANCIAL RESULTS
Revenue and headline earnings for the year amounted to R180.4 million and R113.4 million respectively. The table below summarises Stor-Age’s underlying results of operations for the 12-month period compared to the forecast set out in the prospectus.
Property revenue comprises rental income and other income.
Rental income is a function of occupancy – the amount of space let to individual customers – and the rental rate charged for each unit. Rental income for the year amounted to R158.8 million. Excluding the Storage RSA portfolio, rental income was R155.1 million.
The total GLA in the Listed Portfolio at year end was 227 800 m² (2016: 181 300 m²). The 46 500 m² growth in GLA relates to the Storage RSA acquisition (41 800 m²) and the build-out GLA in the existing portfolio of 4 700 m².
Total occupancy grew by 37 700 m² over the year acquisitively (Storage RSA: 33 700 m²) and organically (like-for-like portfolio 4 000 m²) to close at 193 400 m² (85%) at year end (2016: 155 700 m² (86%)). All properties in the Storage RSA portfolio are trading at mature occupancy levels save for Durbanville, a newly opened lease-up property of 7 800 m² GLA which began trading in July 2016. Durbanville is performing in line with expectation and, at year-end, was 35% occupied.
We take a balanced approach to revenue management, and our occupancy growth was accompanied by an increase in our closing rental rate of 12.7% to R86 per m² and like-for-like growth in our achieved average rental rate throughout the period of 9.4%.
Other property income comprises licence fees relating to the opening of new stores in the Managed Portfolio (R3 million) and ancillary income such as the sale of merchandise (e.g. packaging materials and padlocks), administration fees, late fees and other sundry income.
Other revenue comprises property management and asset management fees charged on the Managed Portfolio; and acquisition and development fees charged on the development of new self storage properties. These fees for the year were in line with expectations and the underlying performance of the Managed Portfolio.
Direct property costs comprise mainly store-based employee salaries, rates, utilities, a full allocation of marketing spend and other property-related costs such as insurance, maintenance, IT and communications at a property level. The cost-to-income ratio (direct operating costs as a percentage of property revenue) is 23.4%.
Administrative expenses relate mainly to support function costs for IT, finance, HR, property management, professional fees and directors’ remuneration. These costs are broadly in line with forecast expenditure. We remain focused on managing our cost base tightly to enable revenue growth that translates into earnings growth.
The Company has adopted DPS (dividend per share) as its measure for trading statements.
CAPITAL STRUCTURE
Our financing policy is to fund our current needs through a mix of debt, equity and cash flow to allow the company to expand the portfolio and achieve our strategic growth objectives. The group has term loan facilities of R650 million available with Nedbank. The respective maturities of the various facilities range from November 2017 to November 2020 and accrue interest at an average margin of 1.5% below prime. Further details are set out in note 13 of the annual financial statements.
At 31 March 2017 the group’s total gross borrowings amounted to R252.7 million (2016: R129 million) with 79% (2016: 78%) subject to fixed rates as set out above, and total undrawn borrowing facilities of R397.3 million (2016: R521 million). On a net-debt basis, 82% (2016: 84%) of the group’s borrowings were subject to fixed rates.
The board’s policy is to fix approximately 80% of borrowings. The effective interest rate at year end was 9.36% (2016: 9.39%).
In February 2017, Stor-Age raised R400 million through an accelerated book build by placing 37 million ordinary shares at R10.81 per share. At this level, the book build was oversubscribed, and the proceeds were used to fund the Storage RSA acquisition and reduce associated debt. The development costs for the expansion of our existing Gardens and Durbanville properties of R41 million, as well the acquisition of the Bryanston vacant land of R17.4 million, were funded from our debt facilities.
We maintain a conservative capital structure with net debt at R244.6 million at 31 March 2017 (2016: R119.2 million) and a gearing ratio of 11.9% (2016: 8.7%).
Net asset value per share was R10.68 (2016: R9.90) and net tangible asset value per share was R10.21 (2016: R9.31).
INVESTMENT PROPERTIES
Investment property increased from R1.371 billion at 31 March 2016 to R2.050 billion at year-end. The increase related mainly to acquisition of Storage RSA (R475 million), the expansion at Gardens and Durbanville (R41 million) and the acquisition of the Bryanston development opportunity (R17 million). The fair value adjustment to investment properties was R127 million.
The group’s policy is to annually have one-third of its properties valued by an independent, external valuer and the remaining properties valued by the board, using the same methodology as the external valuer. In line with this policy, 10 of the 30 properties in the group were valued by Mills Fitchet Magnus Penny (a registered valuer) at 31 March 2017. Further details of the basis of valuation are set out in note 3 of the annual financial statements and a summary of the portfolio.