Financial review
The final dividend for the year of 55.38 cents per share is up 9.0% on the prior year and, when added to the interim dividend of 51.30 cents per share, brings the total dividend to 106.68 cents per share, a 9.05% year-on-year increase.
INTRODUCTION
The group’s strong trading performance was achieved in the face of a severely constrained South African economy with low GDP growth, and the continued economic uncertainty in the UK as a result of its protracted withdrawal from the EU. This is testament to the resilient nature of our underlying product as well as our specialist sector focus and expertise, the latter a critical success factor. Our strong balance sheet, reinforced by the debt restructuring and oversubscribed equity raises, continues to provide the flexibility to target select development and acquisition opportunities as they arise.
PORTFOLIO REVIEW
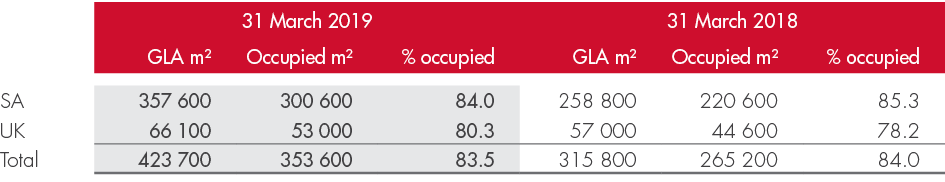
The South African portfolio closed at 357 600 m² GLA, up by 98 800 m² due to the acquisitions of All-Store (6 100 m²) and the Managed Portfolio (86 700 m²) during the year, as well as the opening of Bryanston (3 900 m²) in September 2018 and expansion at existing stores (2 100 m²). The negligible year-on-year decrease in closing occupancy, from 85.3% to 84.0%, reflects the impact of the Managed Portfolio acquisition and the inclusion of the newly completed Bryanston.
The UK portfolio closed at 66 100 m² GLA, up 9 100 m² year-on-year, mainly as a result of the acquisitions of Viking Self Storage Bedford (Viking) and The Storage Pod (Pod) in March 2019. Closing occupancy increased from 78.2% to 80.3%, driven by an increase of 1 300 m² in like-for-like occupancy and the positive impact of acquisitions.
FINANCIAL RESULTS
The table below sets out the group’s underlying operating performance by South Africa and the UK:
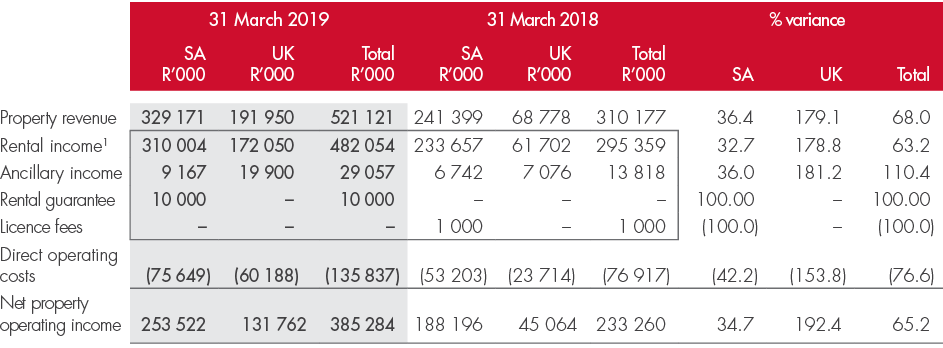
| 1 | Tenant debtors impairment has been offset against rental income. |
The acquisitions in South Africa and the UK have been included for the part-period from their respective acquisition dates. Revenue and earnings show significant increases year-on-year.
Total property revenue increased by 68.0% to R521.1 million (2018: R310.2 million). Rental income for the year was R482.1 million (2018: R295.4 million), a 63.2% increase. On a like-for-like basis (excluding the acquisitions in the 2018 and 2019 financial years) SA rental income increased by 7.5%, driven by a 0.5% increase in average occupancy levels and a 7.0% increase in the average rental rate. The latter was slightly constrained by the 1% increase in VAT from 14% to 15%, effective 1 April 2018. Although we were able to pass on the increase to existing tenants on the effective date, the nature of our dynamic pricing model meant we absorbed a portion of the VAT increase in rentals for new tenants moving in after 1 April 2018. While the growth is slightly lower than previous reporting periods, the like-for-like growth is a pleasing result in the overall context of the South African economic environment with residential and commercial customers under considerable financial strain.
Total occupancy in the South African portfolio grew by 80 000 m² year-on-year. Excluding the impact of acquisitions, occupancy growth in the South African portfolio was 4 500 m² comprising the seven-month lease-up of Bryanston (2 900 m²) and 1 600 m² relating to other properties in the portfolio. The closing rental was up 9.3% year-on-year. Occupancy in the Managed Portfolio grew by 4 400 m² from the acquisition in October 2018 to year end. Rental rate growth in the Managed Portfolio was 10.1% for the full year to March 2019.
The UK portfolio delivered a strong operational performance, broadly as expected. Total occupancy grew by 8 400 m² year-on-year, made up of growth in the like-for-like portfolio of 1 300 m² and from acquisitions of 7 100 m². The closing rental was up 0.8% year-on-year.
Ancillary income (net of related costs) of R29.1 million (2018: R13.8 million) reflects the positive contribution of acquisitions to date. Although ancillary income is a relatively small proportion of total revenue, each component makes a meaningful contribution to earnings with little capital investment. In a more challenging economic environment, the overall performance of this revenue stream plays an important role in generating overall earnings growth. Excluding once-off sundry items in both years (R0.4 million in 2019 and R0.6 m in 2018), ancillary income increased by 12.5% on a like-for-like basis.
The rental guarantee amount of R10.0 million relates to the Managed Portfolio acquisition. The acquisition was structured with a rental guarantee of R44.5 million, paid upfront by the sellers on the effective date of the acquisition, and held in an escrow account. Stor-Age is entitled to draw down on the escrow amount over a 36-month period, with the first period ending 31 March 2019, and thereafter for every six-month period.
Licence fee income of R1.0 million in the prior year relates to the opening of the Randburg property in the Managed Portfolio in July 2017.
Other revenue of R11.1 million (2018: R22.1 million) comprises property and asset management fees charged on the Managed Portfolio and development fees on properties being developed under the CPC* structure. The decrease in these fees is a result of the acquisition of the Managed Portfolio.
| * | Stor-Age entered into the CPC agreements with Stor-Age Property Holdings Proprietary Limited for the development of its self storage properties in Bryanston and Craighall. The CPC structure reduces the development and lease-up risk for Stor-Age and provides an opportunity to develop high-profile properties in prime locations without diluting the group’s distribution growth profile over the medium term. In addition, the CPC is subject to strict independent and regulatory controls. |
The increase in direct operating costs to R135.8 million (2018: R76.9 million) reflects the impact of acquisitions. On a like-for-like basis, direct operating costs increased by 8.2% due to the impact of load shedding (diesel cost to operate generators), increased electricity tariffs and higher municipal rates charged on certain properties. Disciplined cost control remains a key priority.
The increase in administrative expenses from R36.9 million to R43.8 million relates mainly to the Storage King acquisition being included for a full year (2018: five months). This increase is also attributable to the underlying growth in the business, a greater investment in technology, centralisation and automation, the appointment of two additional non-executive directors, and the employment of additional staff.
Interest income of R48.9 million (2018: R23.6 million) comprises interest received on the share purchase scheme loans (R13.8 million), cross-currency interest rate swaps (R30.0 million) and call and money market accounts (R5.1 million). The increase relates mainly to the cross-currency interest rate swaps entered into pursuant to the Storage King transaction.
Interest expense of R81.8 million (2018: R33.1 million) comprises mainly interest on bank borrowings. The increase is due to the GBP-denominated debt arising from the Storage King acquisition and higher levels of South African debt related to acquisitions during the year. Further details of bank borrowings are set out in capital structure below.
CAPITAL STRUCTURE
Our financing policy is to fund our current needs through a mix of debt, equity and cash flow to enable the group to expand the portfolio and achieve our strategic growth objectives.
Details of the group’s borrowing facilities at 31 March 2019 are set out below:
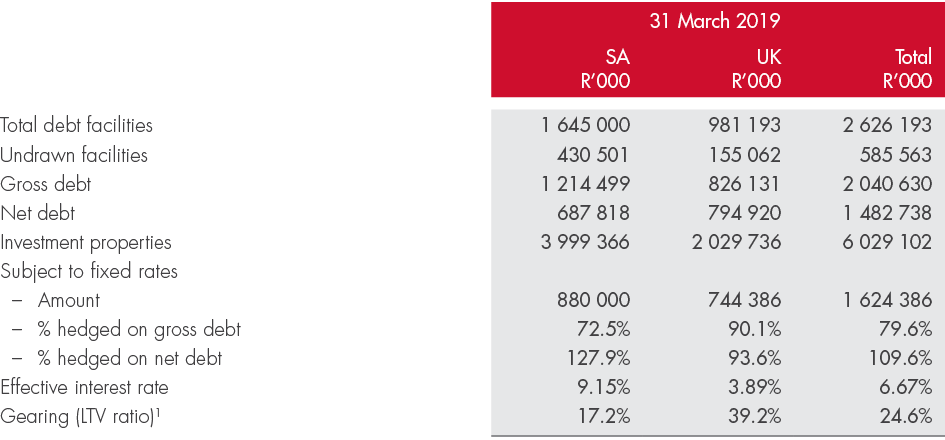
| 1 | LTV ratio is defined as the ratio of debt as a percentage of gross investment property of R6.242 billion less finance lease obligations relating to leasehold investment property of R213 million. |
At 31 March 2019, the group had South African loan facilities of R1.645 billion available. The respective maturities of the facilities range from October 2019 to November 2021, with a weighted average maturity of 2.2 years. R1.125 billion of the facilities accrue interest at an average rate of 1.40% below prime and the remaining R520 million accrues interest at JIBAR plus 1.66%.
The UK loan facility increased from £24.5 million to £52.0 million (R981.1 million) with an expiry date of November 2024. The loan facility is priced at LIBOR plus 2.75% (previously LIBOR plus 3.0%) and is non-amortising (previously amortising).
The interest rate risk on the loan is hedged at approximately 90.0% of the gross debt, in line with underlying LIBOR fixed at 1.17%.
At 31 March 2019, Stor-Age’s total gross borrowings amounted to R2.040 billion (2018: R758.6 million) with 79.6% (2018: 81.6%) subject to fixed rates, and total undrawn borrowing facilities of R585.6 million (2018: R642.4 million).
On a net-debt basis, over 100.0% of borrowings were subject to fixed rates (2018: 99.9%). Net debt stood at R1.483 billion at year end (2018: R619.7 million) with a gearing ratio (LTV) of 24.6% (2018: 16.1%).
The effective interest rate at 31 March 2019 was 6.67% (2018: 6.54%).
The group raised over R1.0 billion in new equity through two accelerated bookbuilds (R400 million in October 2018 and R585 million in March 2019) and a vendor consideration placement of R52.0 million for the acquisition of All-Store. Stor-Age also conserved R75.5 million cash under the dividend reinvestment programme in July 2018 and December 2018.
21 754 530 Ordinary shares issued for cash at R12.00 per share in October 2018 and a further 8 847 880 Ordinary shares issued for cash at R11.65 per share in March 2019. No shares were issued to non-public shareholders as defined in the JSE Listings Requirements.
Net asset value per share (net of non-controlling interest) was R11.70 (2018: R11.49) and net tangible asset value per share (net of non-controlling interest) was R11.34 (2018: R11.01).
CROSS-CURRENCY INTEREST RATES SWAPS (CCIRS) AND HEDGING OF GBP EARNINGS
The acquisition of Storage King in November 2017 was financed through a combination of South African equity capital and UK-denominated debt. The group also makes use of CCIRS as part of its treasury management policy to create a synthetic matching of GBP funding in relation to GBP-denominated assets at optimal levels.
At 31 March 2019, the group had entered into CCIRS with a notional value of £25.0 million (2018: £20.0 million). The notional value of the CCIRS represents an effective hedge of 38.3% (2018: 38.1%) of the net investment in Storage King. The group’s GBP-denominated debt of £43.8 million (2018: £24.5 million), together with the notional value of the CCIRS, equates to an effective hedge of 63.1% (2018: 57.8%) of GBP-denominated assets.
Distributable earnings from the UK are repatriated to South Africa for distribution purposes. To manage the impact of currency volatility, the group adopted a rolling hedging policy using forward exchange contracts (FECs) as follows:
- 12 month forecast – at least 80%
- 13 – 24 month forecast – at least 75%
- 25 – 36 month forecast – at least 50%
FECs entered into by the group at the date of this report are summarised below:
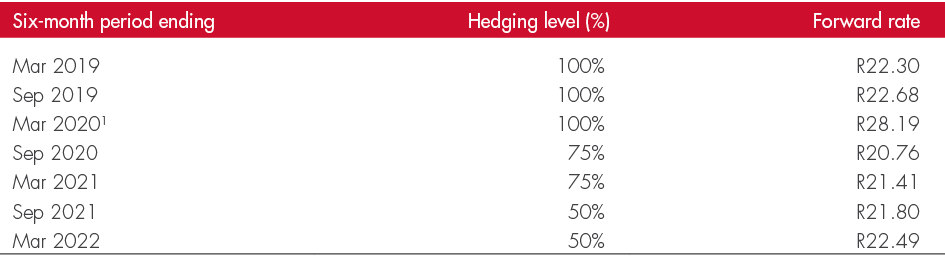
| 1 | The group may elect to restructure this FEC and defer gains to future-dated contracts. |
INVESTMENT PROPERTIES
Gross investment property increased from R4.034 billion at 31 March 2018 to R6.242 billion at year end. The increase related mainly to the acquisitions of the Managed Portfolio (R1.120 billion), Viking (R230 million) and Pod (R215 million) and the CPC* developments (Bryanston and Craighall) of R146 million. The fair value adjustment to investment properties was R86 million and the movement in foreign exchange was R215 million.
| * | Stor-Age entered into the CPC agreements with Stor-Age Property Holdings Proprietary Limited for the development of its self storage properties in Bryanston and Craighall. The CPC structure reduces the development and lease-up risk for Stor-Age and provides an opportunity to develop high-profile properties in prime locations without diluting the group’s distribution growth profile over the medium term. In addition, the CPC is subject to strict independent and regulatory controls. |
The group’s policy is to have at least one-third of the properties externally valued by an independent valuer each year and the remaining properties valued internally by the board, using the same methodology applied by the external valuers. In line with this policy, 17 of the 49 properties in the South African portfolio were valued independently by Mills Fitchet Magnus Penny (members of the South African Institute of Valuers) at 31 March 2019.
For the UK portfolio, 14 of the 16 properties were valued independently by Cushman and Wakefield (registered valuers of the Royal Institution of Chartered Surveyors in the UK) at 31 March 2019. The remaining two properties, Viking and Pod, had been independently valued by Cushman and Wakefield at 30 November 2018.
Further details on the basis of valuation are set out in note 3 of the annual financial statements and a summary of the portfolio is set out here.